jobstats
Description
Job resource monitor tool for a job running on a single compute node.
This script will monitor CPU and NVIDIA GPU % load and memory usage every 10 seconds for a job run on a single compute node and can create graphs.
Usage
Synopsis:
    Job resource monitor tool (% load, GB memory used, $TMPDIR I/O) for a job running on a single compute node.
    This script will monitor CPU and NVIDIA GPU load and memory usage as well as I/O for the /tmp directory every 10 seconds
        for a Slurm job run on a single compute node and can also be used to create graphs.

    CPU Stats:
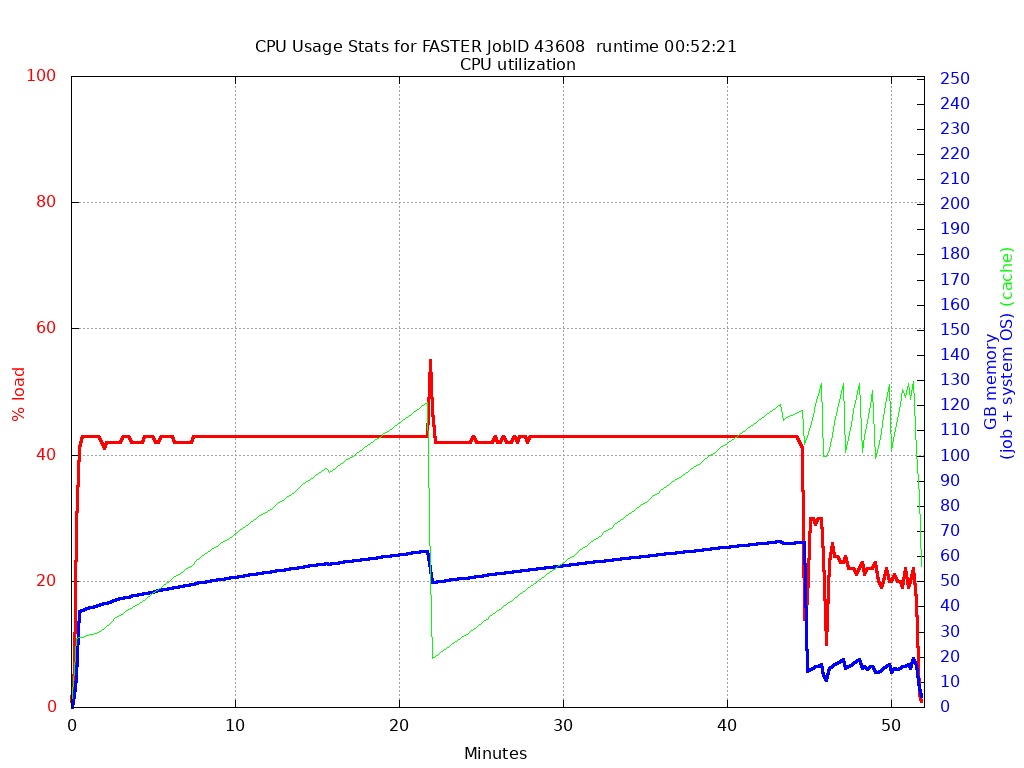
        The CPU usage .png plot is for all cores on the compute node regardless of how many were configured in the job script.
        If you want exclusive CPU stats then reserve the entire compute node for your job.
    GPU Stats:
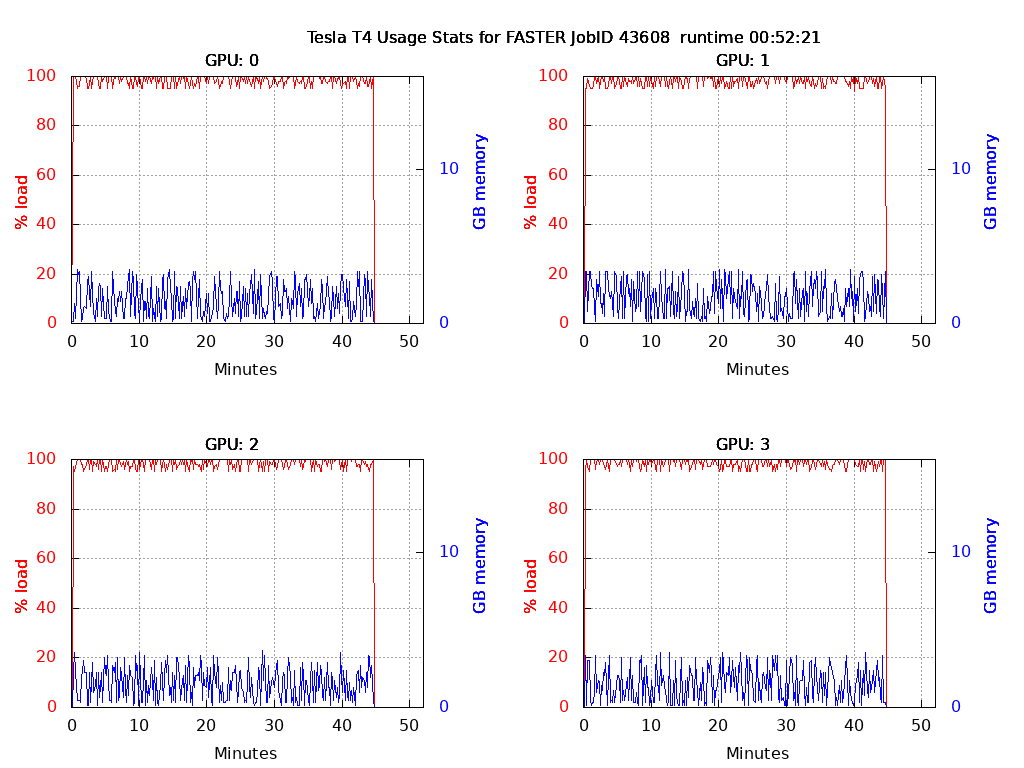
        If GPUs are used, this script will generate a GPU usage plot.
        If 4 or fewer GPUs are requested, a .png file is created.
        A file in .pdf format is created if there are more than 4 GPUs requested.
    I/O Stats:
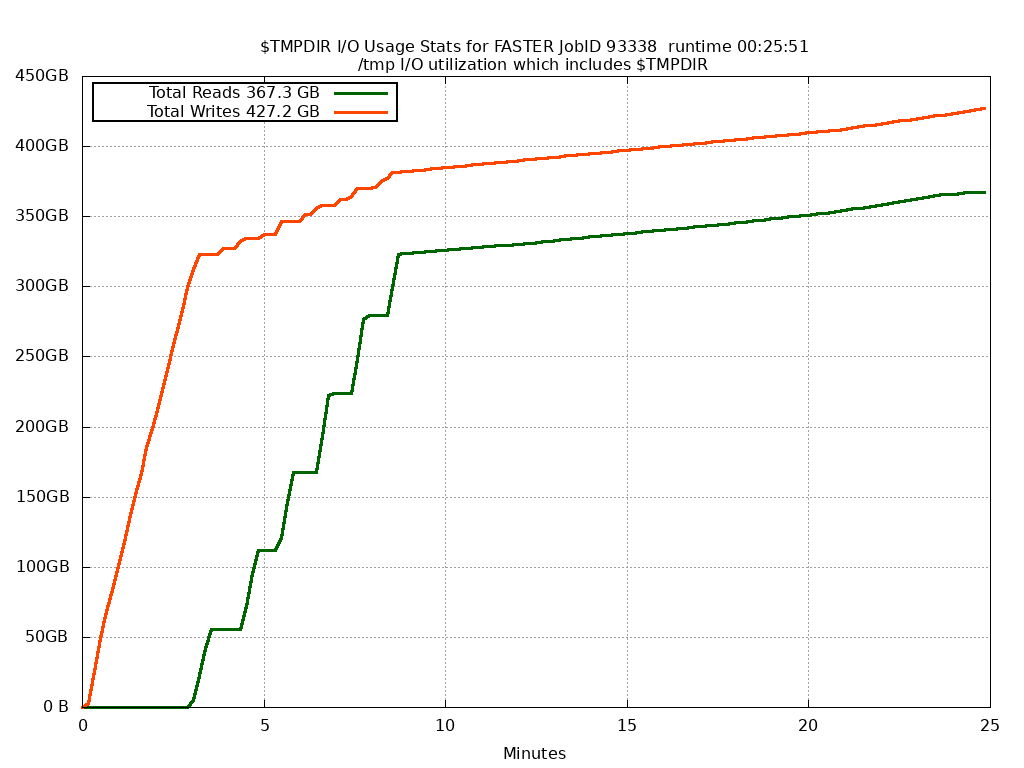
        I/O is logged but a graph is created only if you use the -t flag.
        I/O is for the /tmp directory on the compute node which hosts the job's $TMPDIR as well as any other running jobs.
        If you want exclusive I/O stats then reserve the entire compute node for your job.
        If you change the value of the $TMPDIR variable in your job script, the I/O stats are still for the original job's $TMPDIR directory.

    To start monitoring job resource usage:
        run jobstats in the background (&) inside your job script before running any processes (commands) in your job script.
    To create a graph:
        run jobstats at the end of your job script, not in the background, to create a graph of resource usage for the current job.

    Example job script commands:
      jobstats &
      my_job_command
      more_job_commands
      jobstats

    You can recreate the graph on the login node in the directory that contains the log file stats_gpu.JOBID.log or stats_gpu.JOBID.log.gz
    of an already completed job that used "jobstats &"

      jobstats -j jobID

    Use eog to view .png output files and evince to view .pdf output files.

      eog stats_cpu.JOBID.png
      evince stats_gpu.JOBID.pdf

Note: avoid using the wait command in your job script since jobstats & is sent to the background

Options:
    -i int      query interval in seconds (default: 10)
    -j int      jobID for an already completed Slurm job that used "jobstats &"
    -o str      output directory location of stats_cpu.JOBID.log
    -p          use points instead of lines in GPU plots
    -s          save the gnuplot commands that were used to create the graph to a file
    -t          generate plot for I/O stats for $TMPDIR
    -x          do not monitor I/O
Example graphs
CPU stats

GPU stats

I/O stats
